
Rice Phenotyping for Breeding and Research
Measure morphology, color, chalkiness, and kernel integrity across lines, trials, and environments. Generate per-kernel images and structured outputs for statistical analysis in R or Python.
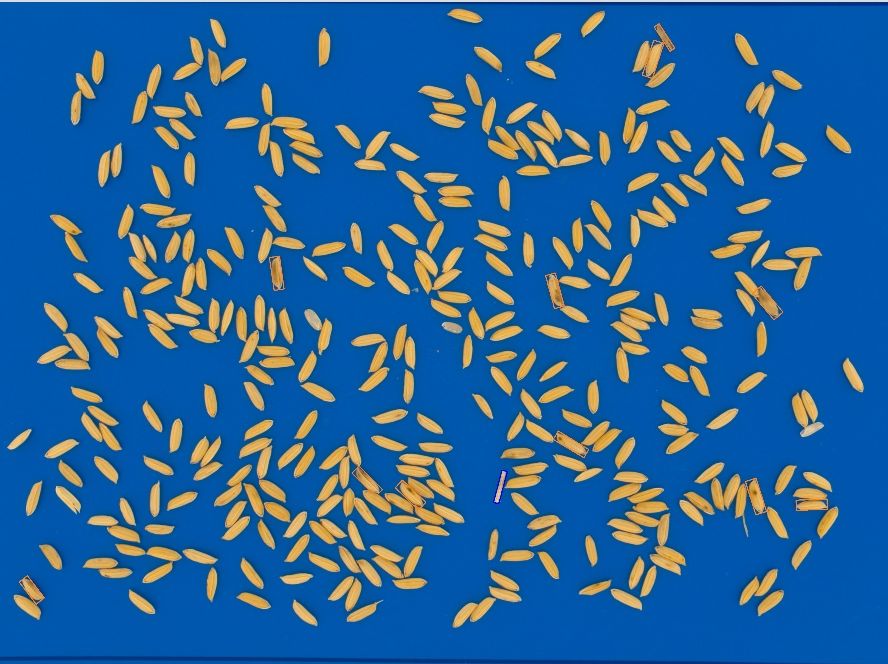
Quantitative rice phenotyping for research programs
Breeding and research teams often need more than a single average for an entire sample. Vibe measures individual kernels so researchers can compare complete trait distributions, identify outliers, and quantify variation within and between lines.
A consistent imaging protocol makes results easier to compare across operators, seasons, locations, and experimental treatments.
What can your program investigate?
Compare breeding lines
Quantify differences in kernel morphology, chalkiness, color, integrity, and trait distributions between lines.
Evaluate G×E and treatment effects
Apply a consistent measurement protocol across locations, seasons, replicates, and experimental treatments.
Verify grain phenotype after selection
Evaluate whether selecting for resistance, tolerance, biofortification, or another target trait affected the resulting grain phenotype.
Build reusable research datasets
Export per-kernel images, measurements, classifications, sample summaries, and metadata for statistical analysis or model development.
Measurements, defined
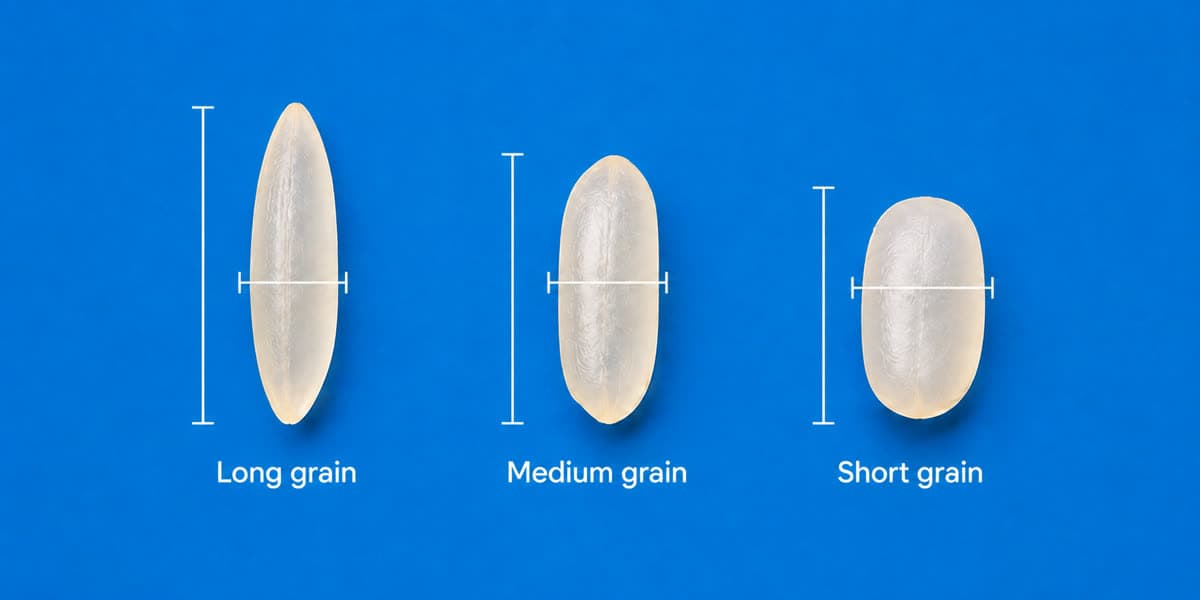
Kernel morphology
Measure length, width, area, aspect ratio, shape, and size distributions for individual kernels.
- Length and width
- Length-to-width ratio
- Long / medium / short class
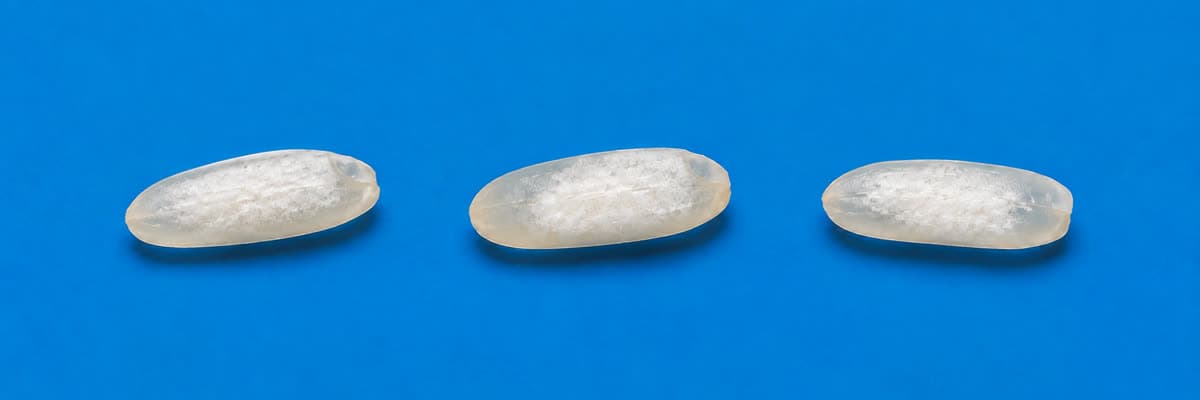
Chalkiness and translucency
Quantify visible chalkiness and translucency using a rice-specific configuration validated for the study material.
- Per-kernel chalky / non-chalky
- Configurable area threshold
- Translucency scoring
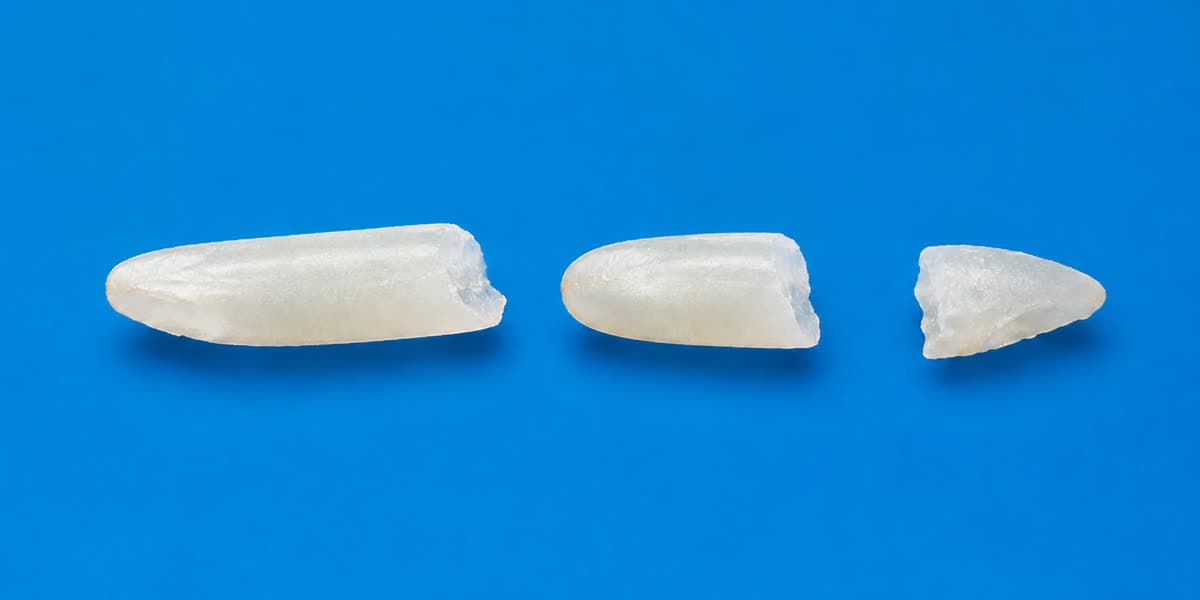
Broken and intact kernels
Separate intact and broken kernels using configured dimensional rules and review the result at the individual-kernel level.
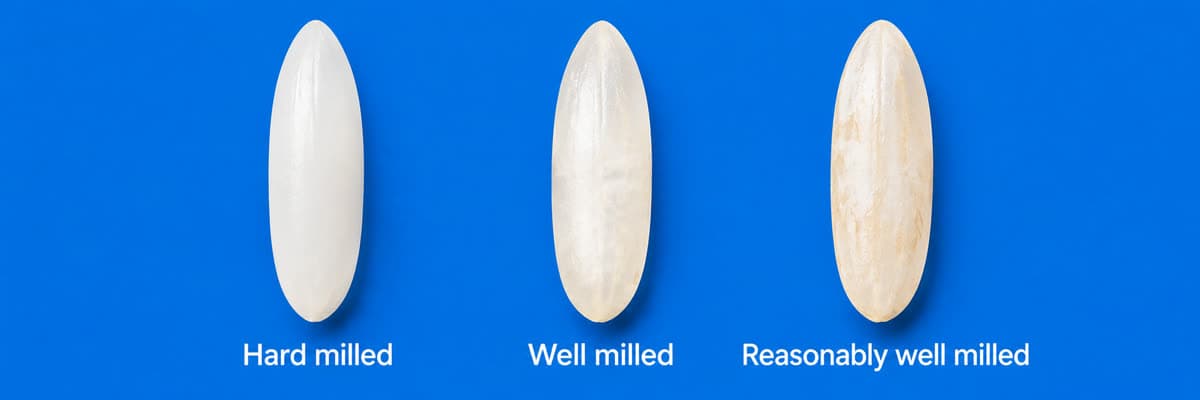
Color and appearance
Compare per-kernel color values, appearance distributions, and validated visual categories across samples.
- L*a*b* color values
- Milling / appearance categories
- Sample-level color distributions
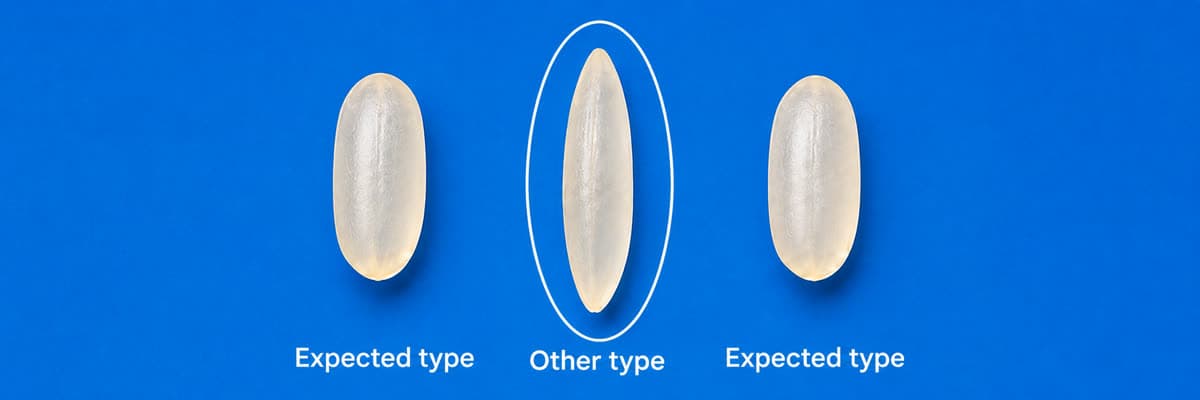
Purity and off-types
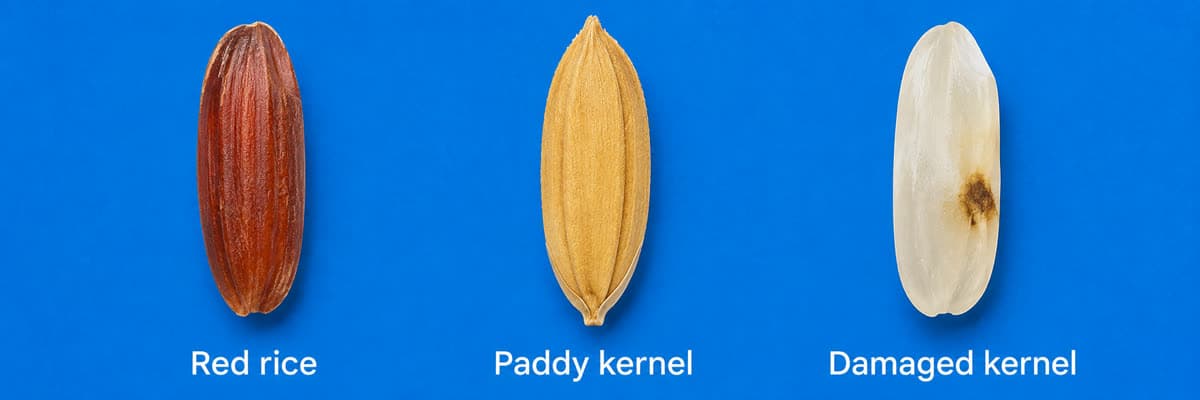
Quantify visually distinct material and user-defined off-types according to the study's classification criteria.
Trait distributions
Compare complete distributions, sample summaries, variation, and outliers instead of relying only on one average value.
From sample to research-ready data
Scan the sample
Measure and classify traits
Compare lines, trials, or treatments
Export data, images, and metadata
The workflow preserves the connection between each kernel, its image, its measurements, and its sample metadata.
Compare lines, trials, and locations
Review per-kernel measurements, sample summaries, distributions, and classifications in the Vibe software. Export the results for independent statistical analysis and reproducible figures.
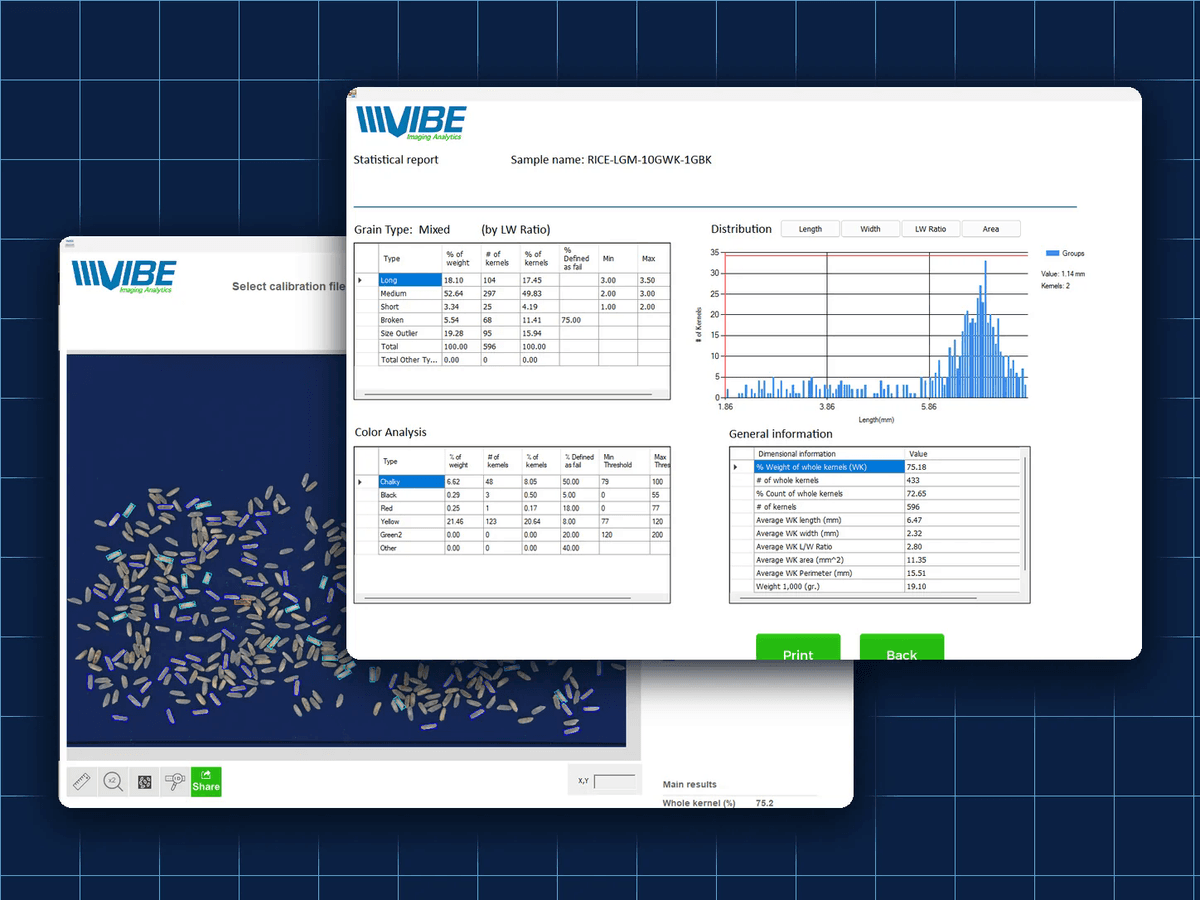 Example QM3i Statistical Report screen for one rice sample.
- Per-kernel measurements
- Sample-level summaries
- Trait distributions
- Reviewable kernel images
- CSV, Parquet, images, and metadata
Grain-type breakdown for one anonymized rice sample, by size class:
| Type | % of weight | # of kernels | % of kernels | Min | Max |
|---|---|---|---|---|---|
| Long | 18.10 | 104 | 17.45 | 3.00 | 3.50 |
| Medium | 52.64 | 297 | 49.83 | 2.00 | 3.00 |
| Short | 3.34 | 25 | 4.19 | 1.00 | 2.00 |
| Broken | 5.54 | 68 | 11.41 | — | — |
| Size Outlier | 19.28 | 95 | 15.94 | — | — |
| Total | 100.00 | 596 | 100.00 | — | — |
Published rice research using Vibe
See how research teams have used Vibe measurements in breeding, grain characterization, biofortification, and cultivar comparison.
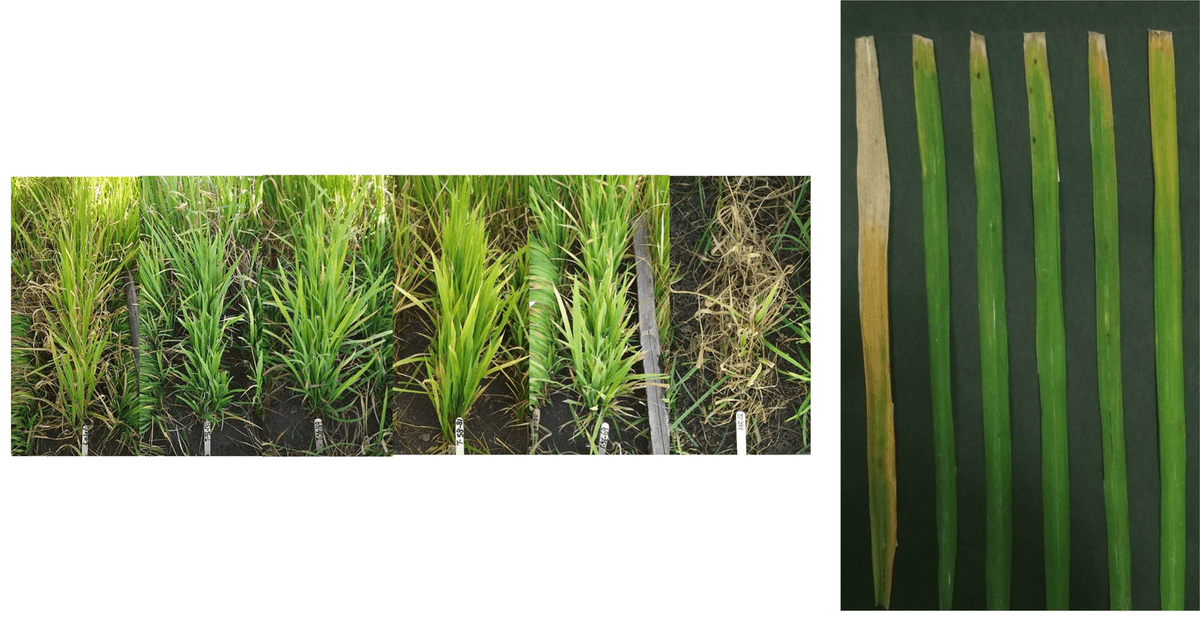
Marker-assisted forward breeding to develop a drought-, bacterial-leaf-blight-, and blast-resistant rice cultivar
What Vibe measured: Grain length and breadth, to confirm grain dimensions were preserved alongside the introgressed resistance and drought-tolerance traits.
Read the publication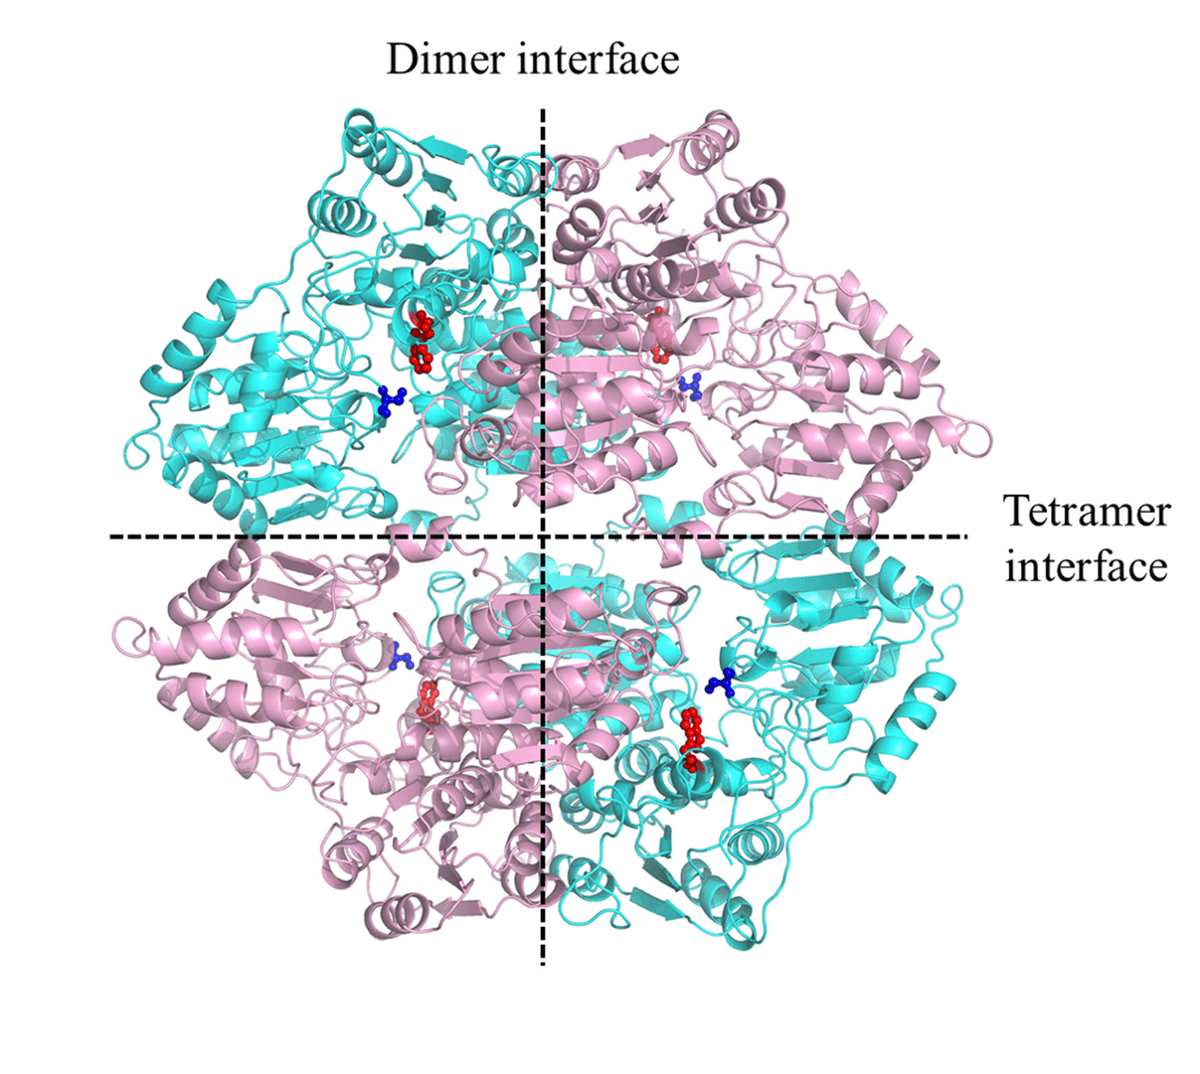
Engineering Herbicide-Tolerance Rice Expressing an Acetohydroxyacid Synthase with a Single Amino Acid Deletion
What Vibe measured: 1000-grain weight, grain width, and grain length, to confirm the mutation did not compromise grain quality.
Read the publication
The acceptance of zinc biofortified rice in Latin America: A consumer sensory study and grain quality characterization
What Vibe measured: Grain length, length-breadth ratio, and chalkiness of biofortified and control varieties.
Read the publicationDeveloping Quick Screening Method to Identify Rice Cultivars with Unique Aromatic Features
What Vibe measured: Kernel length, width, length-to-width ratio, and colour on brown rice across 126 genotypes.
Read the publication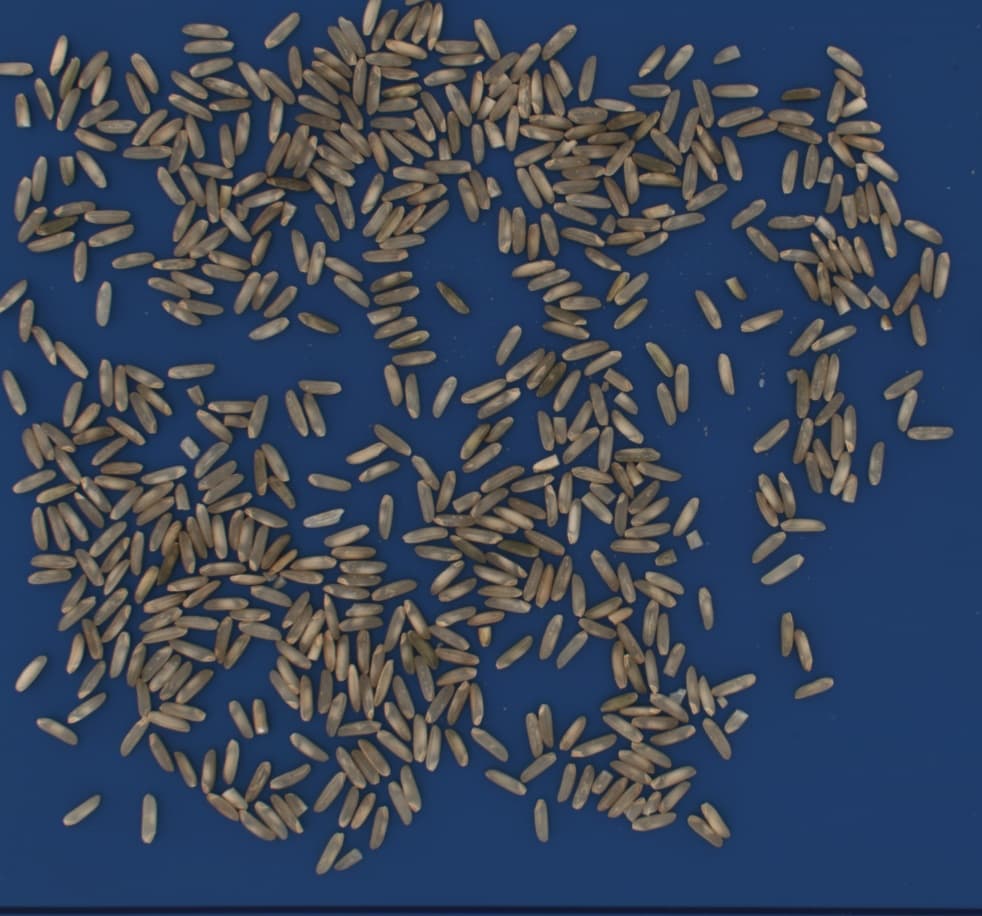
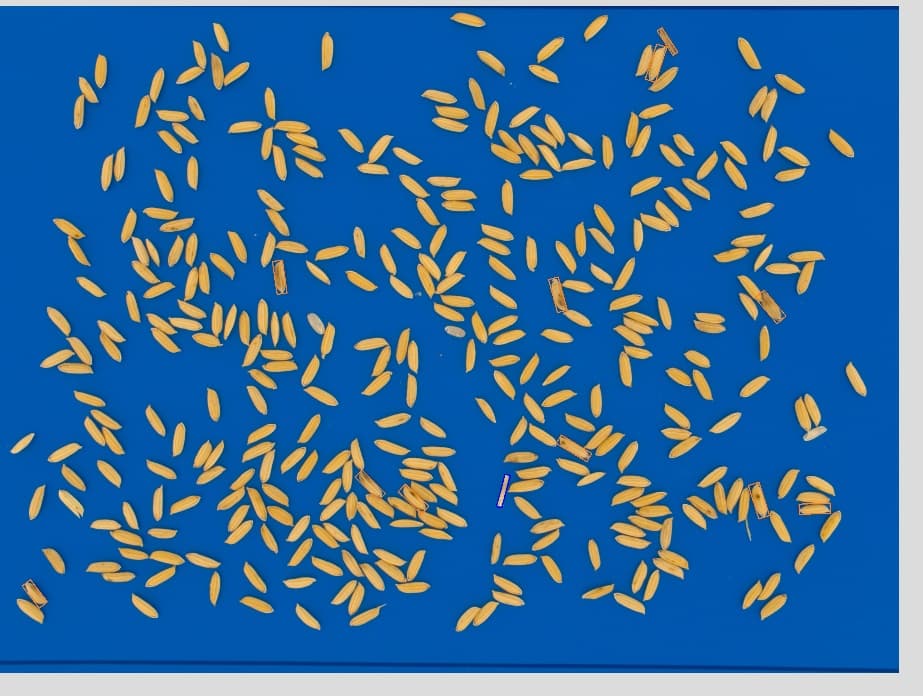
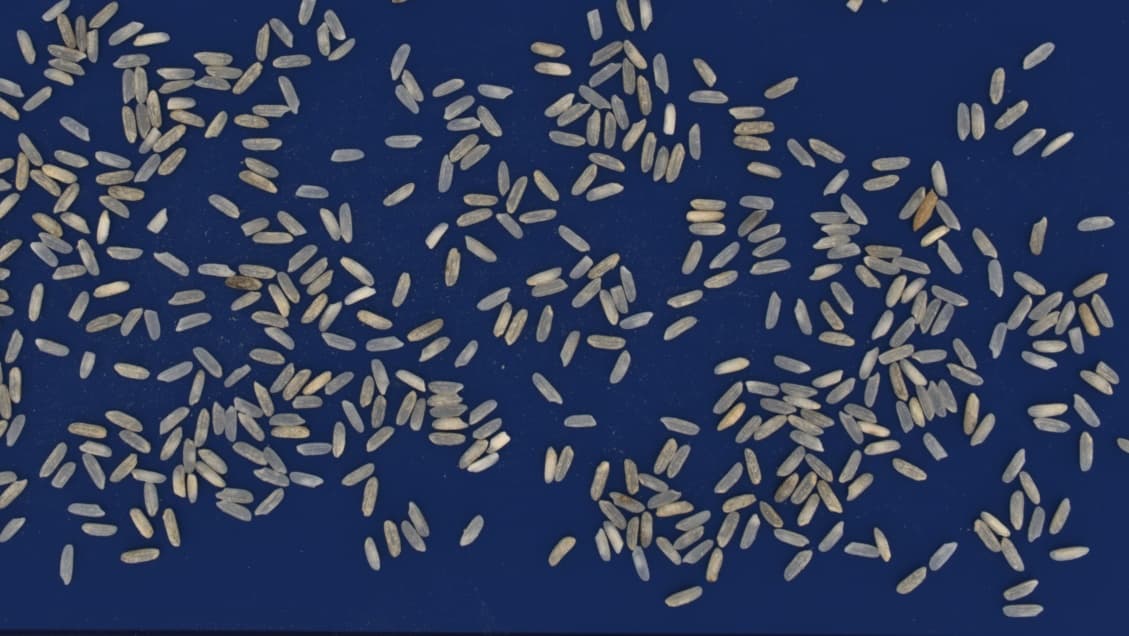
Methods and study configuration
Vibe measures visible rice-kernel morphology, color, integrity, and configured image-based characteristics at individual-kernel and sample levels.
Configure the workflow using representative material, consistent sample presentation, and reference categories appropriate to the study.
Frequently asked questions
Yes. Every kernel in a sample keeps its own record — measurements, classification, and image — exportable as CSV or Parquet with sample metadata, ready for R, Python, or another statistics tool.
Yes. The same imaging protocol applies to every sample, so per-kernel distributions from different lines, trials, seasons, or locations can be compared directly rather than only as single averages.
Yes. Kernels are imaged, not consumed or altered, so the same sample remains available for further testing afterward.
Yes. Chalkiness thresholds, size classes, and off-type or purity criteria can be configured to match a study's own definitions instead of a fixed default.
Vibe measures visible appearance, morphology, color, and kernel integrity.
Related crop types
Planning a rice breeding or phenotyping project?
Tell us which traits you need to measure, how many samples you expect to analyze, and how you plan to use the results. We can help you evaluate whether the Vibe workflow fits your study.