
Wheat Phenotyping for Breeding and Research
Measure kernel morphology, color, texture, and visible Fusarium damage across breeding lines and multi-environment trials. Export per-kernel images and structured data for analysis in R or Python.
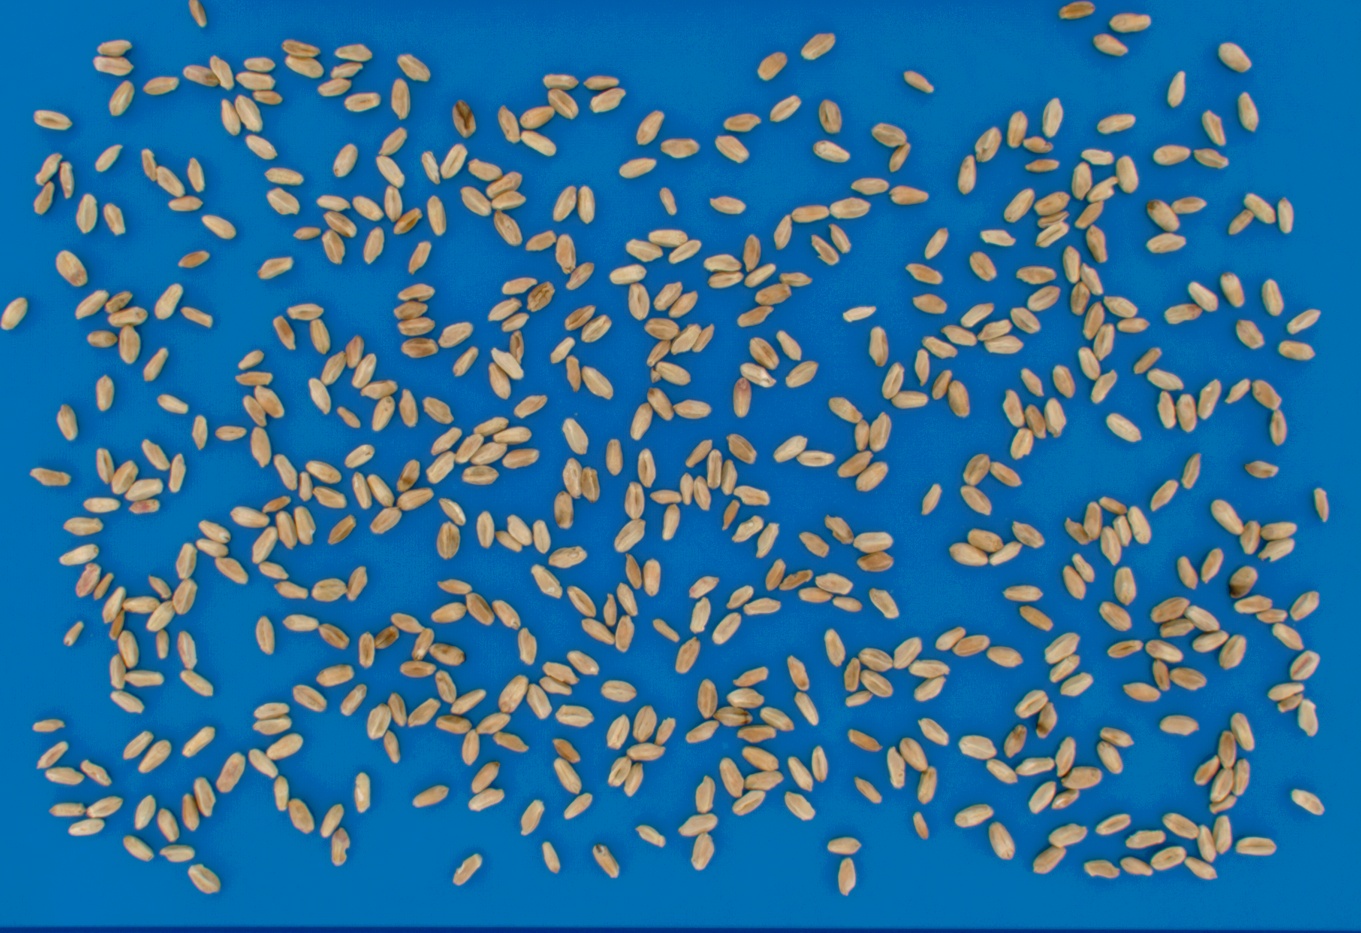
Quantitative wheat phenotyping for research programs
Wheat breeding and crop-science programs often need to characterize large numbers of samples across lines, generations, locations, and seasons. Vibe produces per-kernel images and measurements that allow researchers to compare complete trait distributions, identify outliers, and preserve a repeatable record of each sample.
The resulting data feeds into statistical, GWAS, QTL, genomic-prediction, and genotype-by-environment analyses, giving researchers the phenotype measurements needed for their own genetic and agronomic interpretation.
What can your program investigate?
Compare breeding lines
Quantify differences in kernel length, width, area, shape, color, texture, uniformity, and visible defect distributions across lines.
Evaluate G×E and treatment effects
Apply the same imaging and measurement protocol across locations, seasons, replicates, generations, and experimental treatments.
Quantify visible FDK
Score visible Fusarium-damaged kernels consistently across large trial sets for plant-pathology and breeding research.
Build reusable phenotype datasets
Export per-kernel images, measurements, classifications, sample summaries, and metadata for downstream statistics, GWAS, QTL analysis, genomic prediction, or model development.
Measurements, defined
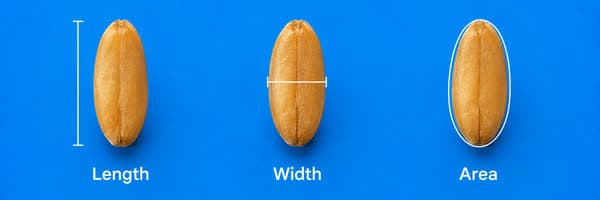
Kernel morphology
Measure per-kernel length, width, area, aspect ratio, shape, and related distributions.
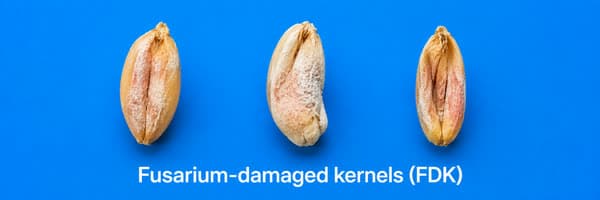
Fusarium-damaged kernels (FDK)
Quantify kernels with visible FDK characteristics and compare their frequency, size, color, and morphology across lines, treatments, and environments.
Designed for consistent visual FDK assessment in breeding and pathology research.
Kernel size and shape distributions
Compare the complete distribution of kernel dimensions rather than relying only on one sample average.
Color and texture
Measure visible color and endosperm-texture characteristics using configurations validated for the relevant wheat material.
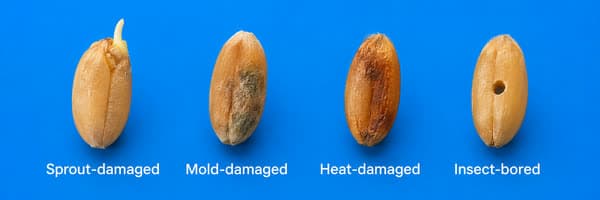
Visible kernel defects
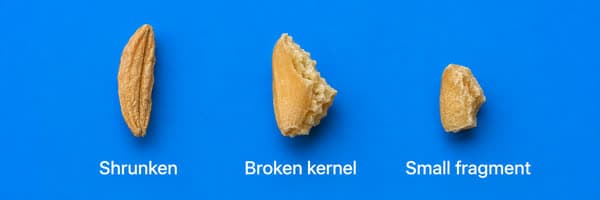
Quantify broken, shriveled, shrunken, discolored, dark-tip, black-tip, and other configured visible categories.
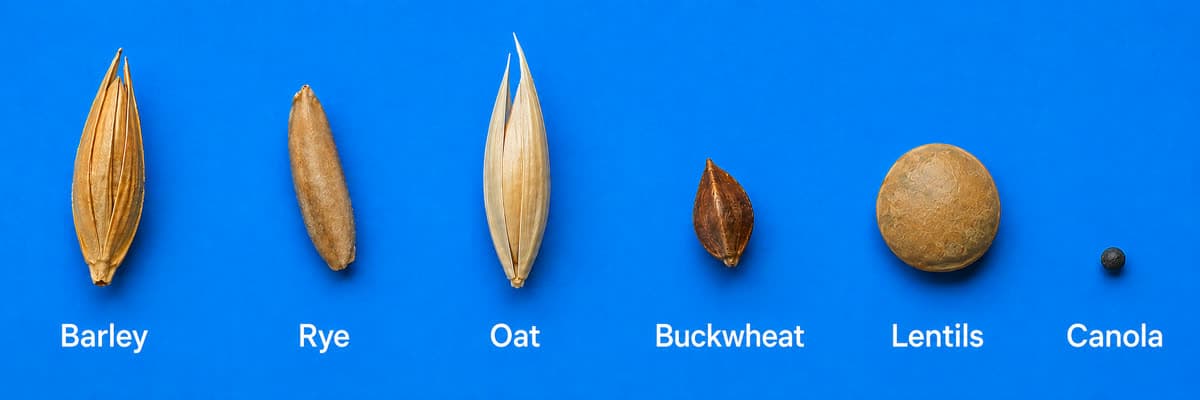
Purity, other grain, and foreign material
Quantify visually distinguishable wheat, other-grain, and foreign-material categories according to the study definitions.
Classes are configured and validated for the material used in the study.
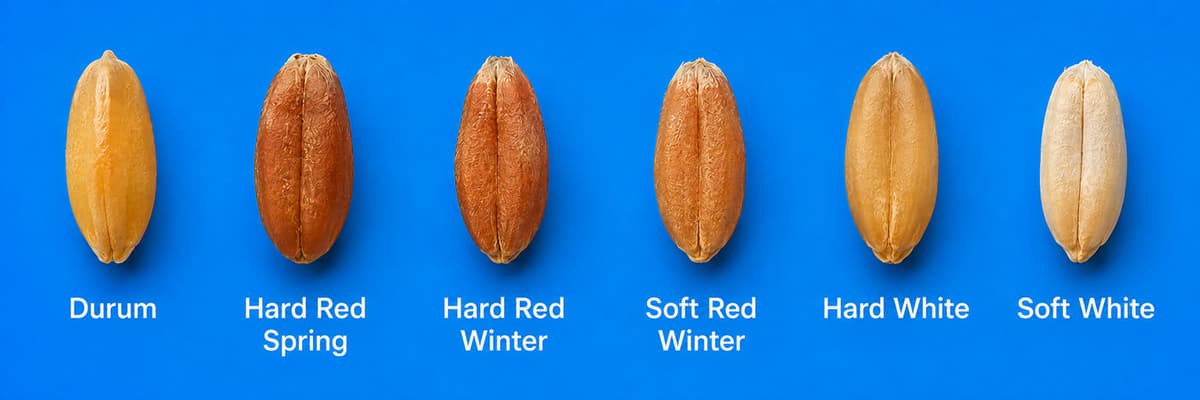
Wheat classes and breeding material
Six wheat classes compared by kernel colour and shape.Research programs can analyze established wheat classes as well as experimental lines and program-specific breeding material. Configurations must be validated for the relevant samples, presentation method, and research question.
From wheat sample to research-ready data
Scan the sample
Measure and classify visible traits
Compare lines, trials, or treatments
Export images, data, and metadata
The workflow preserves the connection between each kernel, its image, its measurements, and its sample metadata.
Compare lines, trials, and environments
Review per-kernel measurements, sample summaries, trait distributions, and classification frequencies in the Vibe software. Export CSV, Parquet, images, and metadata for independent statistical analysis and reproducible figures.
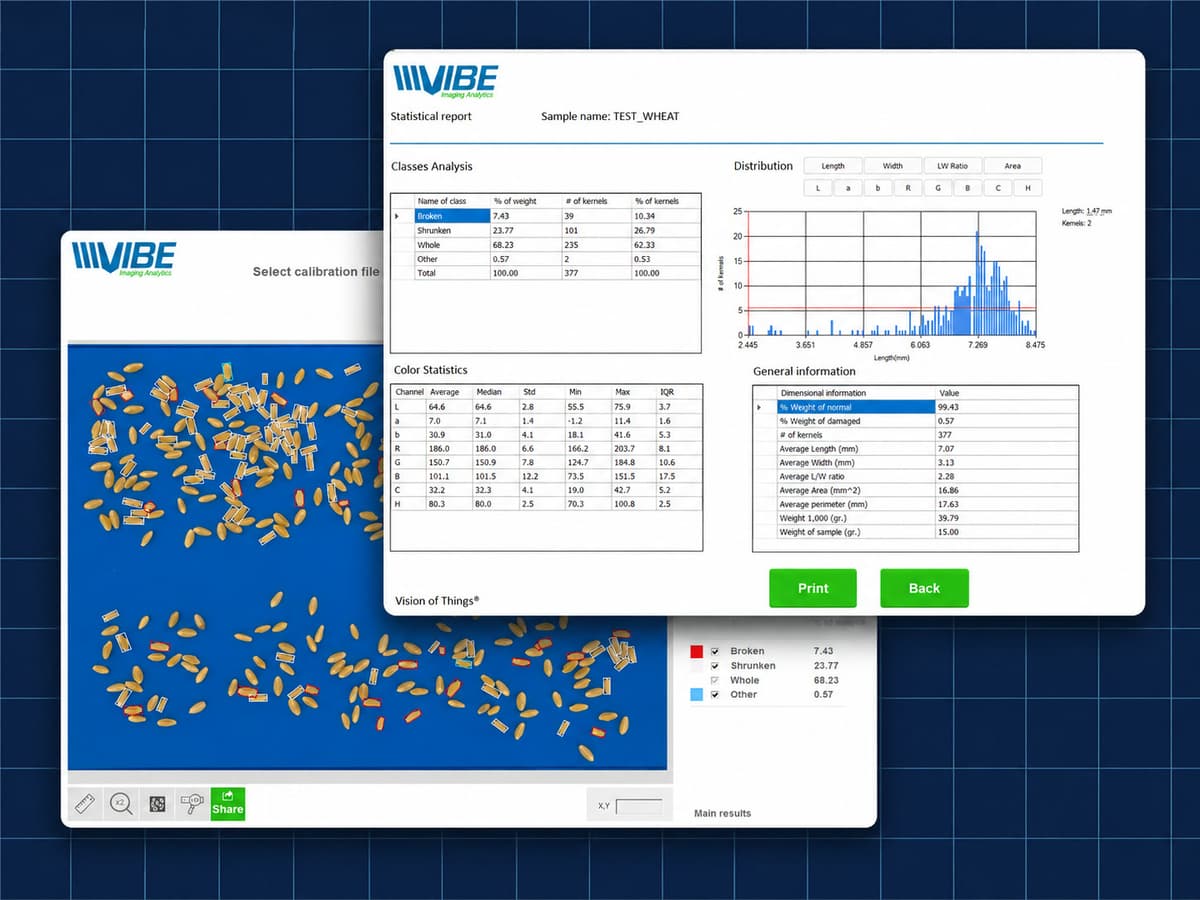 Example QM3i Statistical Report screen for one wheat sample.
- Per-kernel measurements
- Sample-level summaries
- Trait distributions and outliers
- Exportable images and structured data
Published wheat research using Vibe
See how research teams have used Vibe measurements in genomic prediction, GWAS, visual FDK comparison, and kernel-trait yield research.
Evaluating the Potential of Genomic Selection for Grain Yield and Yield Component Traits in South Dakota Winter Wheat
Research question: Can kernel-trait measurements support genomic prediction of grain yield in early-generation breeding lines?
What Vibe measured: Kernel length, width, and area across 1,391 SDSU winter wheat breeding lines.
Read the publicationGenome-wide association analysis of spike and kernel traits in the U.S. hard winter wheat
Research question: Which genomic regions are associated with spike and kernel trait variation in hard winter wheat?
What Vibe measured: Kernel length, width, and area across 297 hard winter wheat accessions.
Read the publicationEvaluation of Methods for Measuring Fusarium-Damaged Kernels of Wheat
Research question: How does image-based visual FDK scoring compare with manual counting, NIR spectroscopy, and laboratory DON quantification?
What Vibe measured: Visible FDK percentage across 1,266 wheat entries. Vibe measured visible FDK. DON was measured separately using laboratory analysis.
Read the publicationA network modeling approach provides insights into the environment-specific yield architecture of wheat
Research question: How do kernel-trait relationships shape yield architecture across different environments?
What Vibe measured: Kernel length, width, area, and weight, used as inputs to a yield-architecture network model.
Read the publication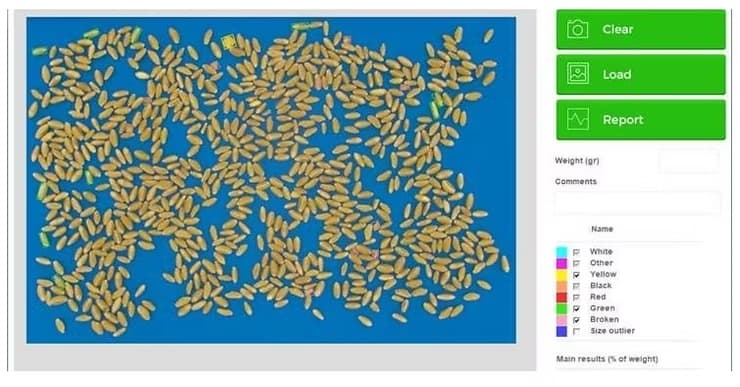
Methods and study configuration
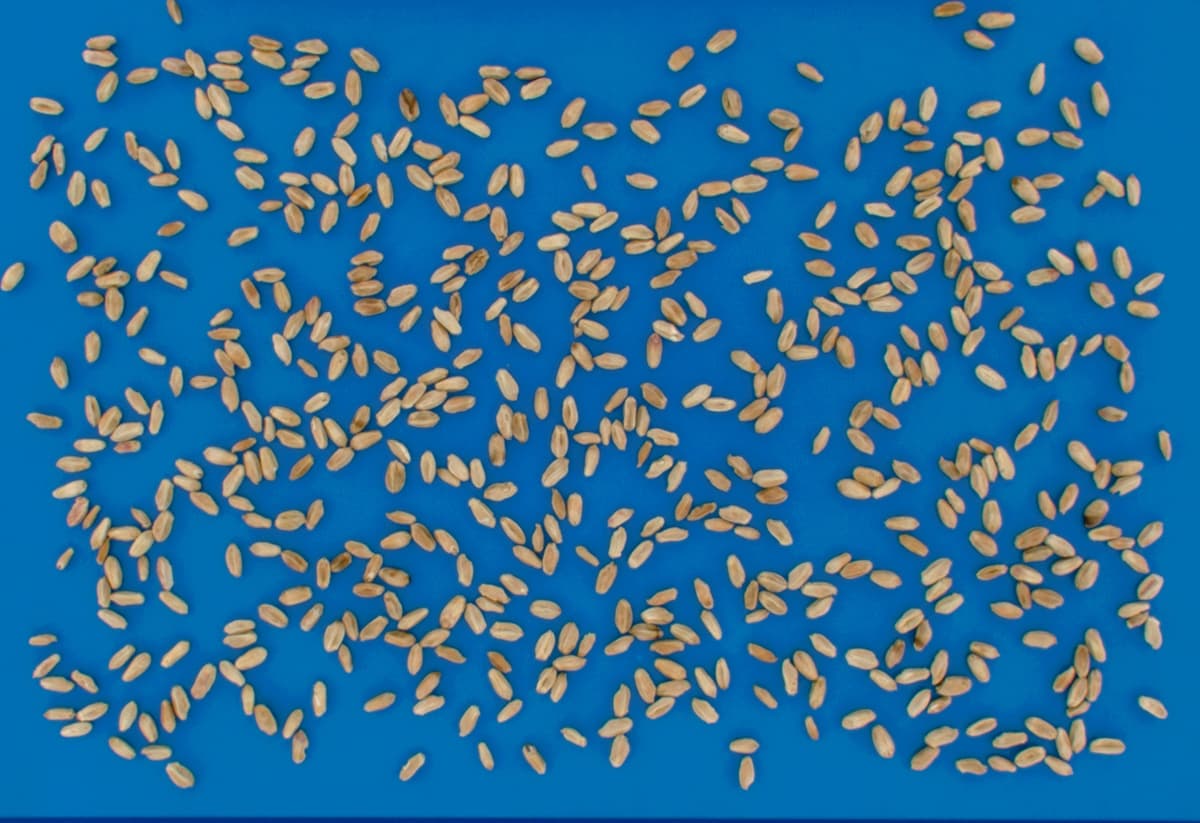
Vibe measures visible wheat-kernel morphology, color, integrity, class composition, FDK, sprouting, shriveling, and other configured visual characteristics.
Configure the workflow with representative material and reference categories appropriate to the breeding, pathology, or grain-trait study. Consistent sample preparation and imaging make it possible to compare results across lines, treatments, locations, seasons, and operators.
Frequently asked questions
Vibe measures kernel morphology (length, width, area, shape), color, texture, visible integrity, and configured visual defect and FDK categories. Results can be integrated with complementary laboratory data for DON, protein, or moisture when those are part of the research design.
Yes. Every kernel keeps its own measurement record and image, exportable as CSV or Parquet with sample metadata for analysis in R, Python, or another statistics tool.
Yes. The same imaging and measurement protocol applies to every sample, so trait distributions from different locations, seasons, or trials can be compared directly.
Researchers can configure visual FDK categories using representative kernels and a defined reference procedure. Vibe then quantifies the frequency and visible characteristics of those kernels across samples, lines, treatments, or environments.
Configurations can be validated to classify established wheat classes or program-specific breeding material by visible characteristics, using representative reference material for the study.
DON, protein, moisture, Falling Number, test weight, and chemical composition all require appropriate laboratory methods. Vibe measures what is visible in the captured images.
Related crop types
Planning a wheat breeding, pathology, or grain-trait study?
Tell us which traits you need to measure, how many samples you expect to analyze, and how you plan to use the results. We can help you evaluate whether the QM3i workflow fits your research protocol.