
Lentil Phenotyping for Breeding and Research
Measure seed morphology, size, color, uniformity, integrity, and visible off-types across lentil lines, trials, and environments. Export per-seed images and structured data for analysis in R, Python, or your existing research workflow.
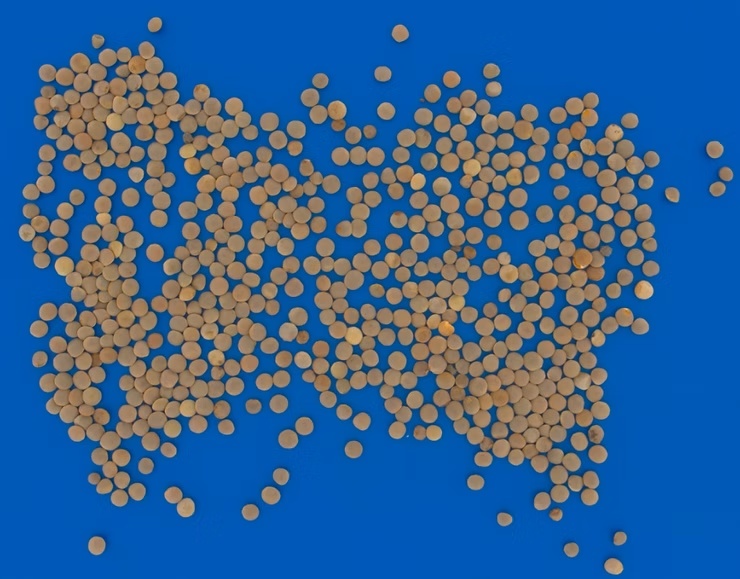
Quantitative lentil phenotyping for research programs
Lentil breeding programs often need to compare seed characteristics across many lines, generations, locations, treatments, and seasons. Measuring individual seeds makes it possible to examine complete trait distributions instead of relying only on a sample average.
A consistent imaging protocol helps researchers quantify variation within and between samples, identify outliers, and preserve images and per-seed records for later review or statistical analysis.
From sample averages to distributions
Examine how traits vary across individual seeds, including the range, median, spread, and frequency of program-defined categories.
Comparable research records
Use consistent sample preparation and imaging procedures to create datasets that can be compared across operators, trials, sites, and seasons.
What can your research program investigate?
Configure the workflow around the phenotype, population, and experimental design relevant to your program.
Compare breeding lines
Measure differences in seed size, area, shape, color, uniformity, and visible integrity across lines, populations, or generations.
Evaluate environments and treatments
Apply the same imaging protocol across locations, seasons, replications, management treatments, and other experimental factors.
Characterize seed appearance
Quantify seed-coat color, visible cotyledon color in split samples, whole or split status, discoloration, damage, and program-defined visual categories.
Build reusable phenotype datasets
Export images, measurements, classifications, sample summaries, and metadata for statistical analysis, breeding decisions, or model development.
Lentil measurements, defined
Each result should describe a visible, measurable seed characteristic. The exact outputs depend on the validated configuration and sample presentation.
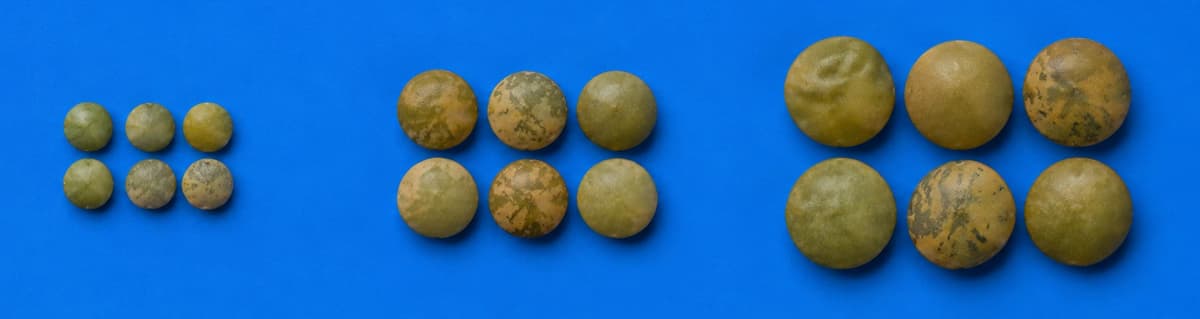
Seed morphology and shape
Measure dimensions and shape descriptors for individual seeds, including diameter-related measurements, projected area, perimeter, circularity, and other configured morphological features.
Useful for comparing lines and examining variation within a population.
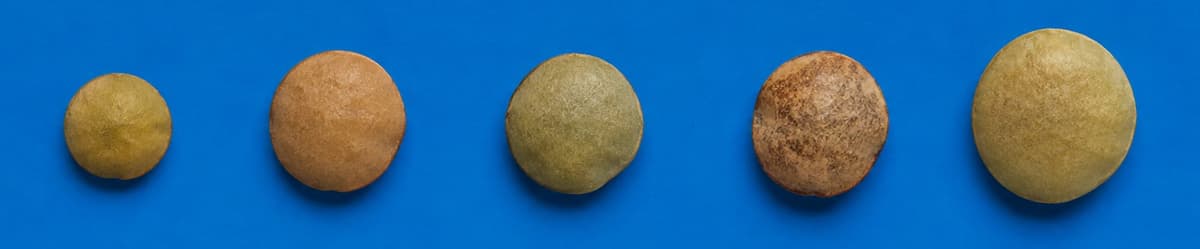
Size distributions
Examine the complete distribution of seed sizes within each sample instead of reporting only a single average.
Review range, median, spread, percentiles, outliers, and frequencies within configured size intervals.

Seed-coat color and uniformity
Quantify visible seed-coat color and color variation under a consistent imaging protocol.
Compare sample uniformity, line differences, and environmental or treatment effects.

Whole, split, and damaged seeds
Identify and quantify configured visual categories such as whole seeds, split material, chips, broken seeds, and visible surface damage.
Categories must be defined and validated for the material used in the study.

Off-types and visible discoloration
Identify and quantify seeds that differ from the predominant sample in color, shape, size, or another configured visible characteristic.
Use program-defined visual categories for consistent comparison and review.

Purity and foreign material
Quantify configured visible seed classes and distinguish lentils from recognizable foreign material when the study requires it.
Results depend on the classes represented in the validated configuration.
Lentil material and seed types
Research programs may analyze green, brown, red, orange, whole, and split lentil material, including experimental lines and program-defined populations. Each configuration should be validated for the relevant material, presentation method, and research question.
Visible characteristics support phenotype comparison within the study's defined categories.
From lentil sample to research-ready data
Use a consistent workflow from sample identification through export so measurements remain connected to the relevant line, plot, treatment, and environment.
Scan the sample
Connect each sample to the line, plot, replication, treatment, location, season, or other experimental metadata.Measure visible traits
Generate per-seed morphology, color, size, and configured classification results.Compare experimental groups
Review sample summaries and distributions across lines, populations, treatments, sites, or seasons.Export research records
Export per-seed measurements, images, classifications, sample summaries, and available metadata.Compare lines, trials, and environments
Move from individual-seed measurements to structured comparisons between experimental groups. Researchers can examine both sample summaries and the distributions behind those summaries.
- Per-seed measurements
- Sample-level summaries
- Trait distributions and outliers
- Frequencies of configured visual classes
- Images for later review
- CSV, Parquet, image, and metadata exports when available
Related pulse research using Vibe
The study below is a related pulse (pea) investigation that used Vibe measurements, included here as the closest available comparison for lentil seed-trait research.
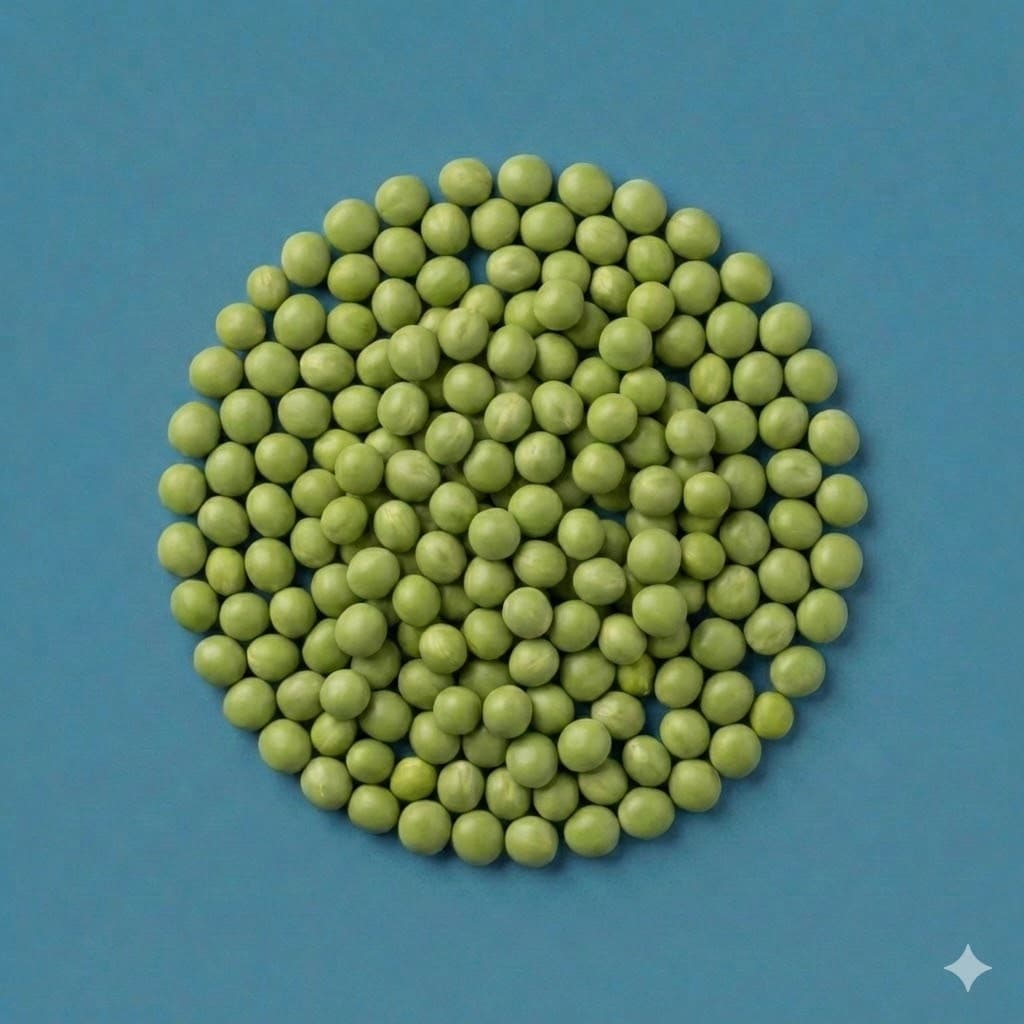
Characterization of yellow pea (Pisum sativum L.) genotypes for performance (agronomic and quality) and stability across environments
What Vibe measured: Thousand-seed weight across 21 yellow pea genotypes and two Washington environments.
Read the publication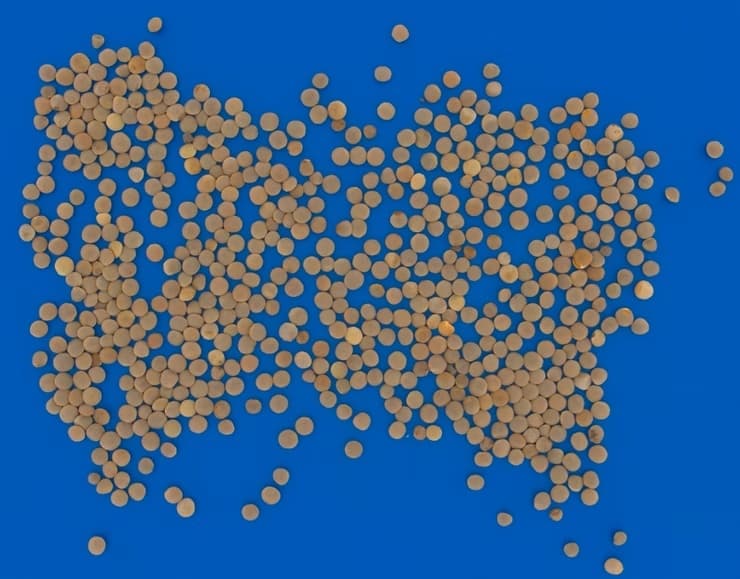

Methods and study configuration
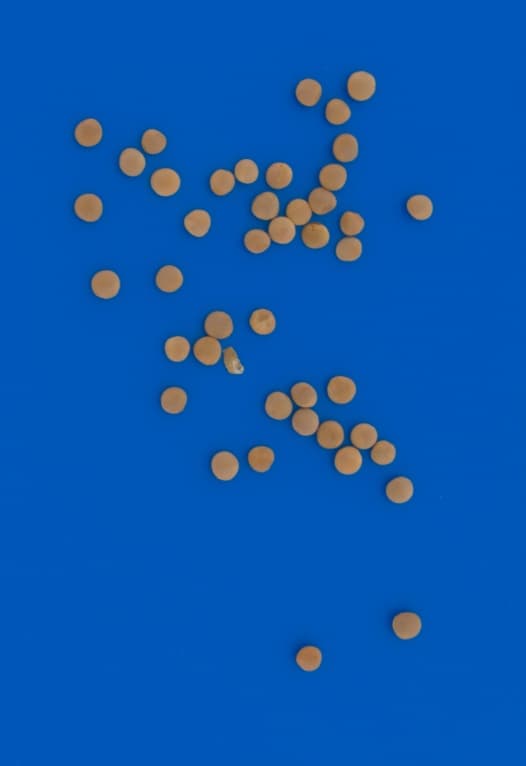
Vibe measures visible lentil dimensions, projected area, shape, seed-coat color, uniformity, whole or split status, damage, off-types, and recognizable foreign material using configured visual classes.
Configure the relevant classes using representative material and a consistent sample-presentation protocol. Export per-seed images, measurements, classifications, and sample summaries for comparison with other experimental results.
Frequently asked questions
Vibe can measure configured visible characteristics such as seed dimensions, projected area, shape, color, uniformity, integrity, and frequencies of defined visual classes. Available outputs depend on the validated configuration.
Yes. Whole and split material can be analyzed when the sample presentation and configuration are designed for those materials. Cotyledon color can only be measured when the cotyledon is visible.
Yes. Depending on the workflow, researchers can export per-seed measurements, classifications, images, sample summaries, and associated metadata for analysis in tools such as R or Python.
A consistent protocol can support comparisons across sites and seasons. Researchers should control sample preparation and presentation and confirm performance using representative material from the study.
Researchers define the relevant visual categories using representative material from the study. These categories can describe differences in color, size, shape, integrity, or other visible characteristics important to the program.
Chemical composition, germination, viability, cooking quality, genetic identity, disease resistance, and non-visible internal characteristics require appropriate complementary methods.
Related crop types
Planning a lentil breeding or seed-trait study?
Tell us which traits you need to measure, how many samples you expect to analyze, and how you plan to use the results. We can help you evaluate whether the QM3i workflow fits your research protocol.